11.1. Suricata.yaml
Suricata uses the Yaml format for configuration. The Suricata.yaml file included in the source code, is the example configuration of Suricata. This document will explain each option.
At the top of the YAML-file you will find % YAML 1.1. Suricata reads the file and identifies the file as YAML.
11.1.1. Max-pending-packets
With the max-pending-packets setting you can set the number of packets you allow Suricata to process simultaneously. This can range from one packet to tens of thousands/hundreds of thousands of packets. It is a trade of higher performance and the use of more memory (RAM), or lower performance and less use of memory. A high number of packets being processed results in a higher performance and the use of more memory. A low number of packets, results in lower performance and less use of memory. Choosing a low number of packets being processed while having many CPU's/CPU cores, can result in not making use of the whole computer-capacity. (For instance: using one core while having three waiting for processing packets.)
max-pending-packets: 1024
11.1.2. Runmodes
By default the runmode option is disabled. With the runmodes setting you can set the runmode you would like to use. For all runmodes available, enter --list-runmodes in your command line. For more information, see Runmodes.
runmode: autofp
11.1.3. Default-packet-size
For the max-pending-packets option, Suricata has to keep packets in memory. With the default-packet-size option, you can set the size of the packets on your network. It is possible that bigger packets have to be processed sometimes. The engine can still process these bigger packets, but processing it will lower the performance.
default-packet-size: 1514
11.1.4. User and group
It is possible to set the user and group to run Suricata as:
run-as:
  user: suri
  group: suri
11.1.5. PID File
This option sets the name of the PID file when Suricata is run in daemon mode. This file records the Suricata process ID.
pid-file: /var/run/suricata.pid
Note
This configuration file option only sets the PID file when
running in daemon mode. To force creation of a PID file when
not running in daemon mode, use the --pidfile
command line option.
Also, if running more than one Suricata process, each process will need to specify a different pid-file location.
11.1.6. Action-order
All signatures have different properties. One of those is the Action property. This one determines what will happen when a signature matches. There are four types of Action. A summary of what will happen when a signature matches and contains one of those Actions:
Pass
If a signature matches and contains pass, Suricata stops scanning the packet and skips to the end of all rules (only for the current packet). If the signature matches on a TCP connection, the entire flow will be passed but details of the flow will still be logged.
Drop
This only concerns the IPS/inline mode. If the program finds a signature that matches, containing drop, it stops immediately. The packet will not be sent any further. Drawback: The receiver does not receive a message of what is going on, resulting in a time-out (certainly with TCP). Suricata generates an alert for this packet.
Reject
This is an active rejection of the packet. Both receiver and sender receive a reject packet. There are two types of reject packets that will be automatically selected. If the offending packet concerns TCP, it will be a Reset-packet. For all other protocols it will be an ICMP-error packet. Suricata also generates an alert. When in Inline/IPS mode, the offending packet will also be dropped like with the 'drop' action.
Alert
If a signature matches and contains alert, the packet will be treated like any other non-threatening packet, except for this one an alert will be generated by Suricata. Only the system administrator can notice this alert.
Inline/IPS can block network traffic in two ways. One way is by drop and the other by reject.
Rules will be loaded in the order of which they appear in files. But they will be processed in a different order. Signatures have different priorities. The most important signatures will be scanned first. There is a possibility to change the order of priority. The default order is: pass, drop, reject, alert.
action-order:
 - pass
 - drop
 - reject
 - alert
This means a pass rule is considered before a drop rule, a drop rule before a reject rule and so on.
11.1.7. Packet alert queue settings
It is possible to configure the size of the alerts queue that is used to append alerts triggered by each packet.
This will influence how many alerts would be perceived to have matched against a given packet. The default value is 15. If an invalid setting or no value is provided, the engine will fall back to the default.
#Define maximum number of possible alerts that can be triggered for the same
# packet. Default is 15
packet-alert-max: 15
We recommend that you use the default value for this setting unless you are seeing a high number of discarded alerts
(alert_queue_overflow) - see the Discarded and Suppressed Alerts Stats section for more details.
11.1.7.1. Impact on engine behavior
Internally, the Suricata engine represents each packet with a data structure that has its own alert queue. The max size
of the queue is defined by packet-alert-max. The same rule can be triggered by the same packet multiple times. As
long as there is still space in the alert queue, those are appended.
Rules that have the noalert keyword will be checked - in case their signatures have actions that must be applied to the Packet or Flow, then suppressed. They have no effect in the final alert queue.
Rules are queued by priority: higher priority rules may be kept instead of lower priority ones that may have been triggered earlier, if Suricata reaches packet-alert-max for a given packet (a.k.a. packet alert queue overflow).
11.1.7.1.1. Packet alert queue overflow
Once the alert queue reaches its max size, we are potentially at packet alert queue overflow, so new alerts will only be appended in case their rules have a higher priority id (this is the internal id attributed by the engine, not the signature id).
This may happen in two different situations:
a higher priority rule is triggered after a lower priority one: the lower priority rule is replaced in the queue;
a lower priority rule is triggered: the rule is just discarded.
Note
This behavior does not mean that triggered drop rules would have their action ignored, in IPS mode.
11.1.7.2. Discarded and Suppressed Alerts Stats
Both scenarios previously described will be logged as detect.alert_queue_overflow in the stats logs (in stats.log and eve-log's stats event).
When noalert rules match, they appear in the stats logs as detect.alerts_suppressed.
Date: 4/6/2022 -- 17:18:08 (uptime: 0d, 00h 00m 00s)
------------------------------------------------------------------------------------
Counter                                       | TM Name                   | Value
------------------------------------------------------------------------------------
detect.alert                                  | Total                     | 3
detect.alert_queue_overflow                   | Total                     | 4
detect.alerts_suppressed                      | Total                     | 1
In this example from a stats.log, we read that 8 alerts were generated: 3 were kept in the packet queue while 4
were discarded due to packets having reached max size for the alert queue, and 1 was suppressed due to coming from a noalert
rule.
11.1.8. Splitting configuration in multiple files
Some users might have a need or a wish to split their suricata.yaml file in to separate files, this is available vis the 'include' and '!include' keyword. The first example is of taking the contents of the outputs section and storing them in outputs.yaml
# outputs.yaml
- fast
    enabled: yes
    filename: fast.log
    append: yes

...
# suricata.yaml
...

outputs: !include outputs.yaml

...
The second scenario is where multiple sections are migrated to a different YAML file.
# host_1.yaml

max-pending-packets: 2048

outputs:
    - fast
        enabled: yes
        filename: fast.log
        append: yes
# suricata.yaml

include: host_1.yaml

...
If the same section, say outputs is later redefined after the include statement it will overwrite the included file. Therefor any include statement at the end of the document will overwrite the already configured sections.
11.1.9. Event output
11.1.9.1. Default logging directory
In the /var/log/suricata directory, all of Suricata's output (alerts and events) will be stored.
default-log-dir: /var/log/suricata
This directory can be overridden by entering the -l command line parameter or by changing the directory directly in Yaml. To change it with the -l command line parameter, enter the following:
suricata -c suricata.yaml -i eth0 -l /var/log/suricata-logs/
11.1.9.2. Stats
Engine statistics such as packet counters, memory use counters and others can be logged in several ways. A separate text log 'stats.log' and an EVE record type 'stats' are enabled by default.
The stats have a global configuration and a per logger configuration. Here the global config is documented.
# global stats configuration
stats:
  enabled: yes
  # The interval field (in seconds) controls at what interval
  # the loggers are invoked.
  interval: 8
  # Add decode events as stats.
  #decoder-events: true
  # Decoder event prefix in stats. Has been 'decoder' before, but that leads
  # to missing events in the eve.stats records. See issue #2225.
  #decoder-events-prefix: "decoder.event"
  # Add stream events as stats.
  #stream-events: false
Statistics can be enabled or disabled here.
Statistics are dumped on an interval. Setting this below 3 or 4 seconds is not useful due to how threads are synchronized internally.
The decoder events that the decoding layer generates, can create a counter per event type. This behaviour is enabled by default. The decoder-events option can be set to false to disable.
In 4.1.x there was a naming clash between the regular decoder counters and the decoder-event counters. This lead to a fair amount of decoder-event counters not being shown in the EVE.stats records. To address this without breaking existing setups, a config option decoder-events-prefix was added to change the naming of the decoder-events from decoder.<proto>.<event> to decoder.event.<proto>.<event>. In 5.0 this became the default. See issue 2225.
Similar to the decoder-events option, the stream-events option controls whether the stream-events are added as counters as well. This is disabled by default.
11.1.9.3. Outputs
There are several types of output. The general structure is:
outputs:
  - fast:
    enabled: yes
    filename: fast.log
    append: yes/no
Enabling all of the logs, will result in a much lower performance and the use of more disc space, so enable only the outputs you need.
11.1.9.4. Line based alerts log (fast.log)
This log contains alerts consisting of a single line. Example of the appearance of a single fast.log-file line:
10/05/10-10:08:59.667372  [**] [1:2009187:4] ET WEB_CLIENT ACTIVEX iDefense
  COMRaider ActiveX Control Arbitrary File Deletion [**] [Classification: Web
  Application Attack] [Priority: 3] {TCP} xx.xx.232.144:80 -> 192.168.1.4:56068
-fast:                    #The log-name.
   enabled:yes            #This log is enabled. Set to 'no' to disable.
   filename: fast.log     #The name of the file in the default logging directory.
   append: yes/no         #If this option is set to yes, the last filled fast.log-file will not be
                          #overwritten while restarting Suricata.
11.1.9.5. Eve (Extensible Event Format)
This is an JSON output for alerts and events. It allows for easy integration with 3rd party tools like logstash.
outputs:
  # Extensible Event Format (nicknamed EVE) event log in JSON format
  - eve-log:
      enabled: yes
      filetype: regular #regular|syslog|unix_dgram|unix_stream|redis
      filename: eve.json
      # Enable for multi-threaded eve.json output; output files are amended
      # with an identifier, e.g., eve.9.json
      #threaded: false
      #prefix: "@cee: " # prefix to prepend to each log entry
      # the following are valid when type: syslog above
      #identity: "suricata"
      #facility: local5
      #level: Info ## possible levels: Emergency, Alert, Critical,
                   ## Error, Warning, Notice, Info, Debug
      #redis:
      #  server: 127.0.0.1
      #  port: 6379
      #  async: true ## if redis replies are read asynchronously
      #  mode: list ## possible values: list|lpush (default), rpush, channel|publish
      #             ## lpush and rpush are using a Redis list. "list" is an alias for lpush
      #             ## publish is using a Redis channel. "channel" is an alias for publish
      #  key: suricata ## key or channel to use (default to suricata)
      # Redis pipelining set up. This will enable to only do a query every
      # 'batch-size' events. This should lower the latency induced by network
      # connection at the cost of some memory. There is no flushing implemented
      # so this setting as to be reserved to high traffic suricata.
      #  pipelining:
      #    enabled: yes ## set enable to yes to enable query pipelining
      #    batch-size: 10 ## number of entry to keep in buffer

      # Include top level metadata. Default yes.
      #metadata: no

      types:
        - alert:
            # payload: yes             # enable dumping payload in Base64
            # payload-buffer-size: 4kb # max size of payload buffer to output in eve-log
            # payload-printable: yes   # enable dumping payload in printable (lossy) format
            # packet: yes              # enable dumping of packet (without stream segments)
            # http-body: yes           # Requires metadata; enable dumping of http body in Base64
            # http-body-printable: yes # Requires metadata; enable dumping of http body in printable format

            # Enable the logging of tagged packets for rules using the
            # "tag" keyword.
            tagged-packets: yes

            # Configure the metadata to be logged along with an
            # alert. The following shows the default configuration
            # which is used if this field is not provided or simply
            # set to a truthful value. Setting of this section is only
            # required if you wish to enable/disable specific fields.
            #metadata:

              # Include the decoded application layer (ie. http, dns)
              app-layer: true

              # Log the the current state of the flow record.
              flow: true

              rule:
                # Log the metadata field from the rule in a structured
                # format.
                metadata: true

                # Log the raw rule text.
                raw: false

            # HTTP X-Forwarded-For support by adding an extra field or overwriting
            # the source or destination IP address (depending on flow direction)
            # with the one reported in the X-Forwarded-For HTTP header. This is
            # helpful when reviewing alerts for traffic that is being reverse
            # or forward proxied.
            xff:
              enabled: no
              # Two operation modes are available, "extra-data" and "overwrite".
              mode: extra-data
              # Two proxy deployments are supported, "reverse" and "forward". In
              # a "reverse" deployment the IP address used is the last one, in a
              # "forward" deployment the first IP address is used.
              deployment: reverse
              # Header name where the actual IP address will be reported, if more
              # than one IP address is present, the last IP address will be the
              # one taken into consideration.
              header: X-Forwarded-For
        - http:
            extended: yes     # enable this for extended logging information
            # custom allows additional http fields to be included in eve-log
            # the example below adds three additional fields when uncommented
            #custom: [Accept-Encoding, Accept-Language, Authorization]
        - dns:
            # Use version 2 logging with the new format:
            # dns answers will be logged in one single event
            # rather than an event for each of the answers.
            # Without setting a version the version
            # will fallback to 1 for backwards compatibility.
            version: 2

            # Enable/disable this logger. Default: enabled.
            #enabled: no

            # Control logging of requests and responses:
            # - requests: enable logging of DNS queries
            # - responses: enable logging of DNS answers
            # By default both requests and responses are logged.
            #requests: no
            #responses: no

            # Format of answer logging:
            # - detailed: array item per answer
            # - grouped: answers aggregated by type
            # Default: all
            #answer-format: [detailed, grouped]

            # Answer types to log.
            # Default: all
            #answer-types: [a, aaaa, cname, mx, ns, ptr, txt]
        - dns:
            # Version 1 DNS logger.
            # Deprecated: Will be removed by May 2022.
            version: 1

            enabled: no
            # control logging of queries and answers
            # default yes, no to disable
            query: yes     # enable logging of DNS queries
            answer: yes    # enable logging of DNS answers
            # control which RR types are logged
            # all enabled if custom not specified
            #custom: [a, aaaa, cname, mx, ns, ptr, txt]
        - tls:
            extended: yes     # enable this for extended logging information
            # output TLS transaction where the session is resumed using a
            # session id
            #session-resumption: no
            # custom allows to control which tls fields that are included
            # in eve-log
            #custom: [subject, issuer, session_resumed, serial, fingerprint, sni, version, not_before, not_after, certificate, chain]
        - files:
            force-magic: no   # force logging magic on all logged files
            # force logging of checksums, available hash functions are md5,
            # sha1 and sha256
            #force-hash: [md5]
        #- drop:
        #    alerts: yes      # log alerts that caused drops
        #    flows: all       # start or all: 'start' logs only a single drop
        #                     # per flow direction. All logs each dropped pkt.
        - smtp:
            #extended: yes # enable this for extended logging information
            # this includes: bcc, message-id, subject, x_mailer, user-agent
            # custom fields logging from the list:
            #  reply-to, bcc, message-id, subject, x-mailer, user-agent, received,
            #  x-originating-ip, in-reply-to, references, importance, priority,
            #  sensitivity, organization, content-md5, date
            #custom: [received, x-mailer, x-originating-ip, relays, reply-to, bcc]
            # output md5 of fields: body, subject
            # for the body you need to set app-layer.protocols.smtp.mime.body-md5
            # to yes
            #md5: [body, subject]

        # NFS logging. Requires Rust.
        - nfs
        # IKEv2 logging. Requires Rust.
        - ikev2
        - ssh
        - stats:
            totals: yes       # stats for all threads merged together
            threads: no       # per thread stats
            deltas: no        # include delta values
        - dhcp:
            # DHCP logging requires Rust.
            enabled: yes
            # When extended mode is on, all DHCP messages are logged
            # with full detail. When extended mode is off (the
            # default), just enough information to map a MAC address
            # to an IP address is logged.
            extended: no
        # bi-directional flows
        - flow
        # uni-directional flows
        #- netflow

        # An event for logging metadata, specifically pktvars when
        # they are set, but will also include the full metadata object.
        #- metadata
For more advanced configuration options, see Eve JSON Output.
The format is documented in Eve JSON Format.
11.1.9.6. A line based log of HTTP requests (http.log)
This log keeps track of all HTTP-traffic events. It contains the HTTP request, hostname, URI and the User-Agent. This information will be stored in the http.log (default name, in the suricata log directory). This logging can also be performed through the use of the Eve-log capability.
Example of a HTTP-log line with non-extended logging:
07/01/2014-04:20:14.338309 vg.no [**] / [**] Mozilla/5.0 (Macintosh; Intel Mac OS X 10_9_2)
AppleWebKit/537.36 (KHTML, like Gecko) Chrome/35.0.1916.114 Safari/537.36 [**]
192.168.1.6:64685 -> 195.88.54.16:80
Example of a HTTP-log line with extended logging:
07/01/2014-04:21:06.994705 vg.no [**] / [**] Mozilla/5.0 (Macintosh; Intel Mac OS X 10_9_2)
AppleWebKit/537.36 (KHTML, like Gecko) Chrome/35.0.1916.114 Safari/537.36 [**] <no referer> [**]
GET [**] HTTP/1.1 [**] 301 => http://www.vg.no/ [**] 239 bytes [**] 192.168.1.6:64726 -> 195.88.54.16:80
- http-log:                     #The log-name.
    enabled: yes                #This log is enabled. Set 'no' to disable.
    filename: http.log          #The name of the file in the default logging directory.
    append: yes/no              #If this option is set to yes, the last filled http.log-file will not be
                                # overwritten while restarting Suricata.
    extended: yes               # If set to yes more information is written about the event.
11.1.9.7. Packet log (pcap-log)
With the pcap-log option you can save all packets, that are registered by Suricata, in a log file named _log.pcap_. This way, you can take a look at all packets whenever you want. In the normal mode a pcap file is created in the default-log-dir. It can also be created elsewhere if a absolute path is set in the yaml-file.
The file that is saved in example the default -log-dir /var/log/suricata, can be be opened with every program which supports the pcap file format. This can be Wireshark, TCPdump, Suricata, Snort and many others.
The pcap-log option can be enabled and disabled.
There is a size limit for the pcap-log file that can be set. The default limit is 32 MB. If the log-file reaches this limit, the file will be rotated and a new one will be created. The pcap-log option has an extra functionality for "Sguil":http://sguil.sourceforge.net/ that can be enabled in the 'mode' option. In the sguil mode the "sguil_base_dir" indicates the base directory. In this base dir the pcaps are created in a Sguil-specific directory structure that is based on the day:
$sguil_base_dir/YYYY-MM-DD/$filename.<timestamp>
If you would like to use Suricata with Sguil, do not forget to enable (and if necessary modify) the base dir in the suricata.yaml file. Remember that in the 'normal' mode, the file will be saved in default-log-dir or in the absolute path (if set).
The pcap files can be compressed before being written to disk by setting the compression option to lz4. This option is incompatible with sguil mode. Note: On Windows, this option increases disk I/O instead of reducing it. When using lz4 compression, you can enable checksums using the lz4-checksum option, and you can set the compression level lz4-level to a value between 0 and 16, where higher levels result in higher compression.
By default all packets are logged except:
TCP streams beyond stream.reassembly.depth
encrypted streams after the key exchange
- pcap-log:
    enabled:  yes
    filename: log.pcap

    # Limit in MB.
    limit: 32

    mode: sguil # "normal" (default) or sguil.
    sguil_base_dir: /nsm_data/
11.1.9.8. Verbose Alerts Log (alert-debug.log)
This is a log type that gives supplementary information about an alert. It is particularly convenient for people who investigate false positives and who write signatures. However, it lowers the performance because of the amount of information it has to store.
- alert-debug:                  #The log-name.
    enabled: no                 #This log is not enabled. Set 'yes' to enable.
    filename: alert-debug.log   #The name of the file in the default logging directory.
    append: yes/no              #If this option is set to yes, the last filled fast.log-file will not be
                                # overwritten while restarting Suricata.
11.1.9.9. Alert output to prelude (alert-prelude)
To be able to use this type, you have to connect with the prelude manager first.
Prelude alerts contain a lot of information and fields, including the IPfields in of the packet which triggered the alert. This information can be divided in three parts:
The alert description (sensor name, date, ID (sid) of the rule, etc). This is always included
The packets headers (almost all IP fields, TCP UDP etc. if relevant)
A binary form of the entire packet.
Since the last two parts can be very big (especially since they are stored in the Prelude SQL database), they are optional and controlled by the two options 'log_packet_header' and 'log_packet_content'. The default setting is to log the headers, but not the content.
The profile name is the name of the Prelude profile used to connect to the prelude manager. This profile must be registered using an external command (prelude-admin), and must match the uid/gid of the user that will run Suricata. The complete procedure is detailed in the Prelude Handbook.
- alert-prelude:                #The log-name.
     enabled: no                #This log is not enabled. Set 'yes' to enable.
     profile: suricata          #The profile-name used to connect to the prelude manager.
     log_packet_content: no     #The log_packet_content is disabled by default.
     log_packet_header: yes     #The log _packet_header is enabled by default.
11.1.9.10. Stats
In stats you can set the options for stats.log. When enabling stats.log you can set the amount of time in seconds after which you want the output-data to be written to the log file.
- stats:
     enabled: yes               #By default, the stats-option is enabled
     filename: stats.log        #The log-name. Combined with the default logging directory
                                #(default-log-dir) it will result in /var/log/suricata/stats.log.
                                #This directory can be overruled with a absolute path. (A
                                #directory starting with / ).
     append: yes/no             #If this option is set to yes, the last filled fast.log-file will not be
                                #overwritten while restarting Suricata.
The interval and several other options depend on the global stats section as described above.
11.1.9.11. Syslog
With this option it is possible to send all alert and event output to syslog.
- syslog:                       #This is a output-module to direct log-output to several directions.
     enabled: no                #The use of this output-module is not enabled.
     facility: local5           #In this option you can set a syslog facility.
     level: Info                #In this option you can set the level of output. The possible levels are:
                                #Emergency, Alert, Critical, Error, Warning, Notice, Info and Debug.
11.1.9.12. File-store (File Extraction)
The file-store output enables storing of extracted files to disk and configures where they are stored.
The following shows the configuration options for version 2 of the file-store output.
- file-store:
    # This configures version 2 of the file-store.
    version: 2

    enabled: no

    # Set the directory for the filestore. If the path is not
    # absolute will be be relative to the default-log-dir.
    #dir: filestore

    # Write out a fileinfo record for each occurrence of a
    # file. Disabled by default as each occurrence is already logged
    # as a fileinfo record to the main eve-log.
    #write-fileinfo: yes

    # Force storing of all files. Default: no.
    #force-filestore: yes

    # Override the global stream-depth for sessions in which we want
    # to perform file extraction. Set to 0 for unlimited; otherwise,
    # must be greater than the global stream-depth value to be used.
    #stream-depth: 0

    # Uncomment the following variable to define how many files can
    # remain open for filestore by Suricata. Default value is 0 which
    # means files get closed after each write
    #max-open-files: 1000

    # Force logging of checksums, available hash functions are md5,
    # sha1 and sha256. Note that SHA256 is automatically forced by
    # the use of this output module as it uses the SHA256 as the
    # file naming scheme.
    #force-hash: [sha1, md5]
11.1.10. Detection engine
11.1.10.1. Inspection configuration
The detection-engine builds internal groups of signatures. Suricata loads signatures, with which the network traffic will be compared. The fact is, that many rules certainly will not be necessary. (For instance: if there appears a packet with the UDP-protocol, all signatures for the TCP-protocol won't be needed.) For that reason, all signatures will be divided in groups. However, a distribution containing many groups will make use of a lot of memory. Not every type of signature gets its own group. There is a possibility that different signatures with several properties in common, will be placed together in a group. The quantity of groups will determine the balance between memory and performance. A small amount of groups will lower the performance yet uses little memory. The opposite counts for a higher amount of groups. The engine allows you to manage the balance between memory and performance. To manage this, (by determining the amount of groups) there are several general options: high for good performance and more use of memory, low for low performance and little use of memory. The option medium is the balance between performance and memory usage. This is the default setting. The option custom is for advanced users. This option has values which can be managed by the user.
detect:
  profile: medium
  custom-values:
    toclient-groups: 2
    toserver-groups: 25
  sgh-mpm-context: auto
  inspection-recursion-limit: 3000
At all of these options, you can add (or change) a value. Most signatures have the adjustment to focus on one direction, meaning focusing exclusively on the server, or exclusively on the client.
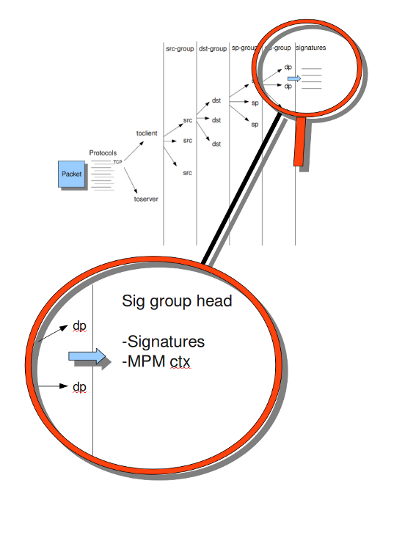
If you take a look at example 4, the Detection-engine grouping tree, you see it has many branches. At the end of each branch, there is actually a 'sig group head'. Within that sig group head there is a container which contains a list with signatures that are significant for that specific group/that specific end of the branch. Also within the sig group head the settings for Multi-Pattern-Matcher (MPM) can be found: the MPM-context.
As will be described again at the part 'Pattern matching settings', there are several MPM-algorithms of which can be chosen from. Because every sig group head has its own MPM-context, some algorithms use a lot of memory. For that reason there is the option sgh-mpm-context to set whether the groups share one MPM-context, or to set that every group has its own MPM-context.
For setting the option sgh-mpm-context, you can choose from auto, full or single. The default setting is 'auto', meaning Suricata selects full or single based on the algorithm you use. 'Full' means that every group has its own MPM-context, and 'single' that all groups share one MPM-context. The two algorithms ac and ac-gfbs are new in 1.03. These algorithms use a single MPM-context if the Sgh-MPM-context setting is 'auto'. The rest of the algorithms use full in that case.
The inspection-recursion-limit option has to mitigate that possible bugs in Suricata cause big problems. Often Suricata has to deal with complicated issues. It could end up in an 'endless loop' due to a bug, meaning it will repeat its actions over and over again. With the option inspection-recursion-limit you can limit this action.
Example 4 Detection-engine grouping tree
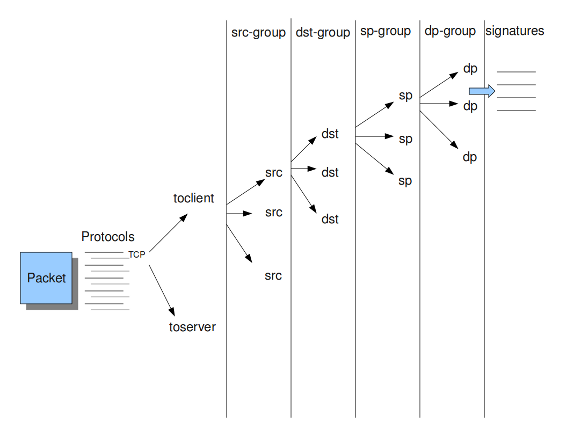
src             Stands for source IP-address.
dst             Stands for destination IP-address.
sp              Stands for source port.
dp              Stands for destination port.
Example 5 Detail grouping tree
11.1.10.2. Prefilter Engines
The concept of prefiltering is that there are far too many rules to inspect individually. The approach prefilter takes is that from each rule one condition is added to prefilter, which is then checked in one step. The most common example is MPM (also known as fast_pattern). This takes a single pattern per rule and adds it to the MPM. Only for those rules that have at least one pattern match in the MPM stage, individual inspection is performed.
Next to MPM, other types of keywords support prefiltering. ICMP itype, icode, icmp_seq and icmp_id for example. TCP window, IP TTL are other examples.
For a full list of keywords that support prefilter, see:
suricata --list-keywords=all
Suricata can automatically select prefilter options, or it can be set manually.
detect:
  prefilter:
    default: mpm
By default, only MPM/fast_pattern is used.
The prefilter engines for other non-MPM keywords can then be enabled in specific rules by using the 'prefilter' keyword.
E.g.
alert ip any any -> any any (ttl:123; prefilter; sid:1;)
To let Suricata make these decisions set default to 'auto':
detect:
  prefilter:
    default: auto
11.1.10.3. Pattern matcher settings
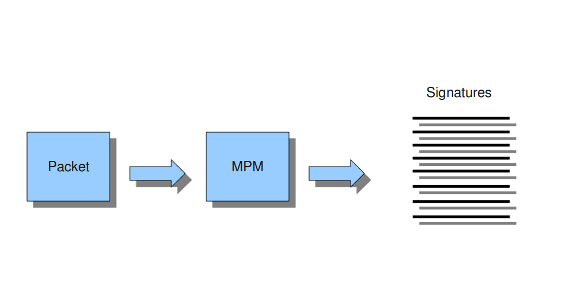
The multi-pattern-matcher (MPM) is a part of the detection engine within Suricata that searches for multiple patterns at once. Often, signatures have one ore more patterns. Of each signature, one pattern is used by the multi-pattern-matcher. That way Suricata can exclude many signatures from being examined, because a signature can only match when all its patterns match.
These are the proceedings:
A packet comes in.
The packed will be analyzed by the Multi-pattern-matcher in search of patterns that match.
All patterns that match, will be further processed by Suricata (signatures).
Example 8 Multi-pattern-matcher
Suricata offers various implementations of different multi-pattern-matcher algorithm's. These can be found below.
To set the multi-pattern-matcher algorithm:
mpm-algo: ac
After 'mpm-algo', you can enter one of the following algorithms: ac, hs and ac-ks.
On x86_64 hs (Hyperscan) should be used for best performance.
11.1.11. Threading
Suricata is multi-threaded. Suricata uses multiple CPUs/CPU cores so it can process a lot of network packets simultaneously. (In a single-core engine, the packets will be processed one at a time.)
There are four thread-modules: Packet acquisition, decode and stream application layer, detection, and outputs.
# The packet acquisition module reads packets from the network.
# The decode module decodes the packets and the stream application application layer has three tasks:
First: it performs stream-tracking, meaning it is making sure all steps will be taken to make a correct network-connection.
Second: TCP-network traffic comes in as packets. The Stream-Assembly engine reconstructs the original stream.
Finally: the application layer will be inspected. HTTP and DCERPC will be analyzed.
# The detection threads will compare signatures. There can be several detection threads so they can operate simultaneously.
# In Outputs all alerts and events will be processed.
Example 6 Threading
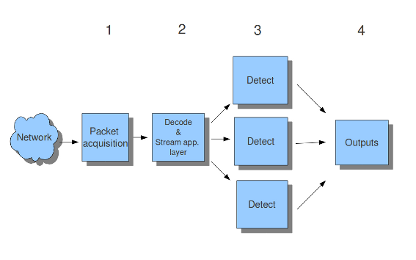
Packet acquisition:             Reads packets from the network
Decode:                         Decodes packets.
Stream app. Layer:              Performs stream-tracking and reassembly.
Detect:                         Compares signatures.
Outputs:                        Processes all events and alerts.
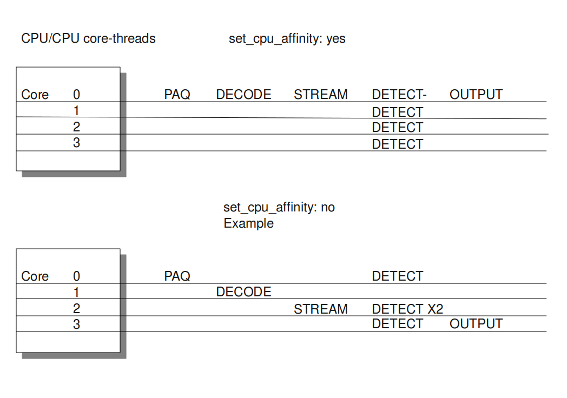
Most computers have multiple CPU's/ CPU cores. By default the operating system determines which core works on which thread. When a core is already occupied, another one will be designated to work on the thread. So, which core works on which thread, can differ from time to time.
There is an option within threading:
set-cpu-affinity: no
With this option you can cause Suricata setting fixed cores for every thread. In that case 1, 2 and 4 are at core 0 (zero). Each core has its own detect thread. The detect thread running on core 0 has a lower priority than the other threads running on core 0. If these other cores are to occupied, the detect thread on core 0 has not much packets to process. The detect threads running on other cores will process more packets. This is only the case after setting the option to 'yes'.
Example 7 Balancing workload
You can set the detect-thread-ratio:
detect-thread-ratio: 1.5
The detect thread-ratio will determine the amount of detect threads. By default it will be 1.5 x the amount of CPU's/CPU cores present at your computer. This will result in having more detection threads then CPU's/ CPU cores. Meaning you are oversubscribing the amount of cores. This may be convenient at times when there have to be waited for a detection thread. The remaining detection thread can become active.
You can alter the per-thread stack-size if the default provided by your build system is too small. The default value is provided by your build system; we suggest setting the value to 8MB if the default value is too small.
stack-size: 8MB
In the option 'cpu affinity' you can set which CPU's/cores work on which thread. In this option there are several sets of threads. The management-, receive-, worker- and verdict-set. These are fixed names and can not be changed. For each set there are several options: cpu, mode, and prio. In the option 'cpu' you can set the numbers of the CPU's/cores which will run the threads from that set. You can set this option to 'all', use a range (0-3) or a comma separated list (0,1). The option 'mode' can be set to 'balanced' or 'exclusive'. When set to 'balanced', the individual threads can be processed by all cores set in the option 'cpu'. If the option 'mode' is set to 'exclusive', there will be fixed cores for each thread. As mentioned before, threads can have different priority's. In the option 'prio' you can set a priority for each thread. This priority can be low, medium, high or you can set the priority to 'default'. If you do not set a priority for a CPU, than the settings in 'default' will count. By default Suricata creates one 'detect' (worker) thread per available CPU/CPU core.
cpu-affinity:
  - management-cpu-set:
      cpu: [ 0 ]  # include only these cpus in affinity settings
  - receive-cpu-set:
      cpu: [ 0 ]  # include only these cpus in affinity settings
  - worker-cpu-set:
      cpu: [ "all" ]
      mode: "exclusive"
      # Use explicitely 3 threads and don't compute number by using
      # detect-thread-ratio variable:
      # threads: 3
      prio:
        low: [ 0 ]
        medium: [ "1-2" ]
        high: [ 3 ]
        default: "medium"
  - verdict-cpu-set:
      cpu: [ 0 ]
      prio:
        default: "high"
11.1.11.1. Relevant cpu-affinity settings for IDS/IPS modes
11.1.11.2. IDS mode
Runmode AutoFp:
management-cpu-set - used for management (example - flow.managers, flow.recyclers)
receive-cpu-set - used for receive and decode
worker-cpu-set - used for streamtcp,detect,output(logging),reject
Rumode Workers:
management-cpu-set - used for management (example - flow.managers, flow.recyclers)
worker-cpu-set - used for receive,streamtcp,decode,detect,output(logging),respond/reject
11.1.11.3. IPS mode
Runmode AutoFp:
management-cpu-set - used for management (example - flow.managers, flow.recyclers)
receive-cpu-set - used for receive and decode
worker-cpu-set - used for streamtcp,detect,output(logging)
verdict-cpu-set - used for verdict and respond/reject
Runmode Workers:
management-cpu-set - used for management (example - flow.managers, flow.recyclers)
worker-cpu-set - used for receive,streamtcp,decode,detect,output(logging),respond/reject, verdict
11.1.12. IP Defrag
Occasionally network packets appear fragmented. On some networks it occurs more often than on others. Fragmented packets exist of many parts. Before Suricata is able to inspect these kind of packets accurately, the packets have to be reconstructed. This will be done by a component of Suricata; the defragment-engine. After a fragmented packet is reconstructed by the defragment-engine, the engine sends on the reassembled packet to rest of Suricata.
At the moment Suricata receives a fragment of a packet, it keeps in memory that other fragments of that packet will appear soon to complete the packet. However, there is a possibility that one of the fragments does not appear. To prevent Suricata for keeping waiting for that packet (thereby using memory) there is a timespan after which Suricata discards the fragments (timeout). This occurs by default after 60 seconds.
In IPS mode, it is possible to tell the engine what to do in case the memcap for the defrag engine is reached: "drop-packet", "pass-packet", or "ignore" (default behavior).
defrag:
  memcap: 32mb
  memcap-policy: ignore  # in IPS mode, what to do if memcap is reached
  hash-size: 65536
  trackers: 65535        # number of defragmented flows to follow
  max-frags: 65535       # number of fragments do keep (higher than trackers)
  prealloc: yes
  timeout: 60
11.1.13. Flow and Stream handling
11.1.13.1. Flow Settings
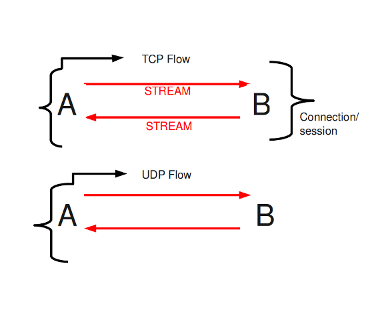
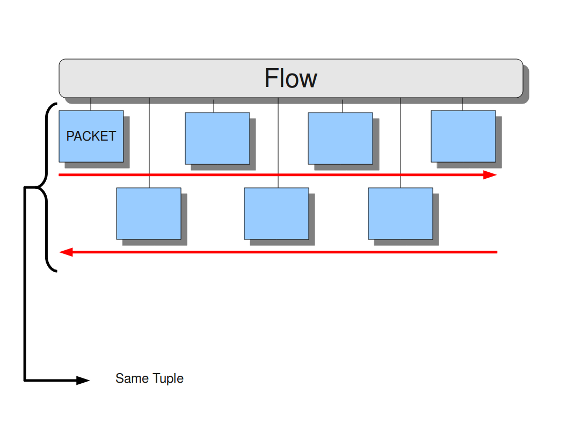
Within Suricata, Flows are very important. They play a big part in the way Suricata organizes data internally. A flow is a bit similar to a connection, except a flow is more general. All packets having the same Tuple (protocol, source IP, destination IP, source-port, destination-port), belong to the same flow. Packets belonging to a flow are connected to it internally.
Example 9 Flow
Example 10 Tuple
Keeping track of all these flows, uses memory. The more flows, the more memory it will cost.
To keep control over memory usage, there are several options:
The option memcap for setting the maximum amount of bytes the flow-engine will use, hash-size for setting the size of the hash-table and prealloc for the following:
For packets not yet belonging to a flow, Suricata creates a new flow. This is a relative expensive action. The risk coming with it, is that attackers /hackers can a attack the engine system at this part. When they make sure a computer gets a lot of packets with different tuples, the engine has to make a lot of new flows. This way, an attacker could flood the system. To mitigate the engine from being overloaded, this option instructs Suricata to keep a number of flows ready in memory. This way Suricata is less vulnerable to these kind of attacks.
The flow-engine has a management thread that operates independent from the packet processing. This thread is called the flow-manager. This thread ensures that wherever possible and within the memcap. There will be 10000 flows prepared.
In IPS mode, a memcap-policy exception policy can be set, telling Suricata what to do in case memcap is hit: 'drop-packet', 'pass-packet', 'reject', or 'ignore'.
flow:
  memcap: 33554432              #The maximum amount of bytes the flow-engine will make use of.
  memcap-policy: bypass         #How to handle the flow if memcap is reached (IPS mode)
  hash_size: 65536              #Flows will be organized in a hash-table. With this option you can set the
                                #size of the hash-table.
  Prealloc: 10000               #The amount of flows Suricata has to keep ready in memory.
At the point the memcap will still be reached, despite prealloc, the flow-engine goes into the emergency-mode. In this mode, the engine will make use of shorter time-outs. It lets flows expire in a more aggressive manner so there will be more space for new Flows.
There are two options: emergency_recovery and prune_flows. The emergency recovery is set on 30. This is the percentage of prealloc'd flows after which the flow-engine will be back to normal (when 30 percent of the 10000 flows is completed).
If during the emergency-mode, the aggressive time-outs do not have the desired result, this option is the final resort. It ends some flows even if they have not reached their time-outs yet. The prune-flows option shows how many flows there will be terminated at each time a new flow is set up.
emergency_recovery: 30                  #Percentage of 1000 prealloc'd flows.
prune_flows: 5                          #Amount of flows being terminated during the emergency mode.
11.1.13.2. Flow Time-Outs
The amount of time Suricata keeps a flow in memory is determined by the Flow time-out.
There are different states in which a flow can be. Suricata distinguishes three flow-states for TCP and two for UDP. For TCP, these are: New, Established and Closed,for UDP only new and established. For each of these states Suricata can employ different timeouts.
The state new in a TCP-flow, means the period during the three way handshake. The state established is the state when the three way handshake is completed. The state closed in the TCP-flow: there a several ways to end a flow. This is by means of Reset or the Four-way FIN handshake.
New in a UDP-flow: the state in which packets are send from only one direction.
Established in a UDP-flow: packets are send from both directions.
In the example configuration the are settings for each protocol. TCP, UDP, ICMP and default (all other protocols).
flow-timeouts:

  default:
    new: 30                     #Time-out in seconds after the last activity in this flow in a New state.
    established: 300            #Time-out in seconds after the last activity in this flow in a Established
                                #state.
    emergency_new: 10           #Time-out in seconds after the last activity in this flow in a New state
                                #during the emergency mode.
    emergency_established: 100  #Time-out in seconds after the last activity in this flow in a Established
                                #state in the emergency mode.
  tcp:
    new: 60
    established: 3600
    closed: 120
    emergency_new: 10
    emergency_established: 300
    emergency_closed: 20
  udp:
    new: 30
    established: 300
    emergency_new: 10
    emergency_established: 100
  icmp:
    new: 30
    established: 300
    emergency_new: 10
    emergency_established: 100
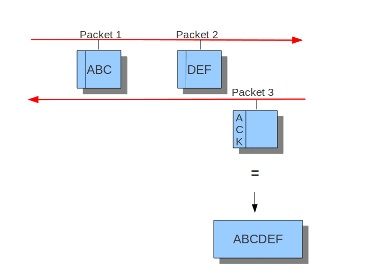
11.1.13.3. Stream-engine
The Stream-engine keeps track of the TCP-connections. The engine exists of two parts: The stream tracking- and the reassembly-engine.
The stream-tracking engine monitors the state of a connection. The reassembly-engine reconstructs the flow as it used to be, so it will be recognized by Suricata.
The stream-engine has two memcaps that can be set. One for the stream-tracking-engine and one for the reassembly-engine. For both cases, in IPS mode, an exception policy (memcap-policy) can be set, telling Suricata what to do in case memcap is hit: 'drop-flow', 'drop-packet', 'pass-flow', 'pass-packet', 'bypass', 'reject', or 'ignore'.
The stream-tracking-engine keeps information of the flow in memory. Information about the state, TCP-sequence-numbers and the TCP window. For keeping this information, it can make use of the capacity the memcap allows.
TCP packets have a so-called checksum. This is an internal code which makes it possible to see if a packet has arrived in a good state. The stream-engine will not process packets with a wrong checksum. This option can be set off by entering 'no' instead of 'yes'.
stream:
  memcap: 64mb                # Max memory usage (in bytes) for TCP session tracking
  memcap-policy: ignore       # In IPS mode, call memcap policy if memcap is reached
  checksum_validation: yes    # Validate packet checksum, reject packets with invalid checksums.
To mitigate Suricata from being overloaded by fast session creation, the option prealloc_sessions instructs Suricata to keep a number of sessions ready in memory.
A TCP-session starts with the three-way-handshake. After that, data can be send en received. A session can last a long time. It can happen that Suricata will be started after a few TCP sessions have already been started. This way, Suricata misses the original setup of those sessions. This setup always includes a lot of information. If you want Suricata to check the stream from that time on, you can do so by setting the option 'midstream' to 'true'. The default setting is 'false'. In IPS mode, it is possible to define a 'midstream-policy', indicating whether Suricata should drop-flow, drop-packet, pass-flow, pass-packet, reject, or bypass a midstream flow. The default is ignore. Normally Suricata is able to see all packets of a connection. Some networks make it more complicated though. Some of the network-traffic follows a different route than the other part, in other words: the traffic goes asynchronous. To make sure Suricata will check the one part it does see, instead of getting confused, the option 'async-oneside' is brought to life. By default the option is set to 'false'.
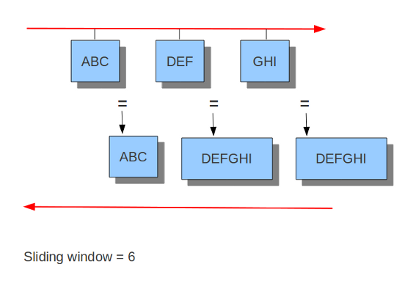
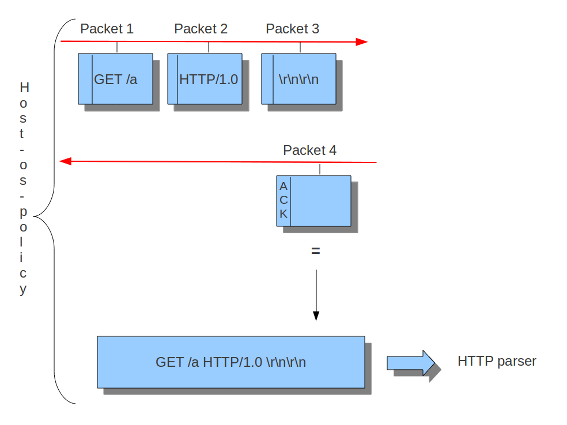
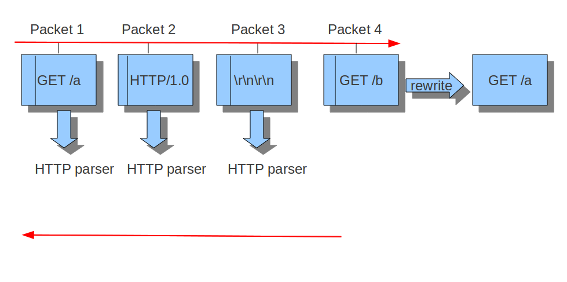
Suricata inspects content in the normal/IDS mode in chunks. In the inline/IPS mode it does that on the sliding window way (see example ..) In the case Suricata is set in inline mode, it has to inspect packets immediately before sending it to the receiver. This way Suricata is able to drop a packet directly if needed.(see example …) It is important for Suricata to note which operating system it is dealing with, because operating systems differ in the way they process anomalies in streams. See Host-os-policy.
prealloc_sessions: 32768     # 32k sessions prealloc'd
midstream: false             # do not allow midstream session pickups
midstream-policy: drop-flow  # in IPS mode, drop flows that start midstream
async_oneside: false         # do not enable async stream handling
inline: no                   # stream inline mode
drop-invalid: yes            # drop invalid packets
bypass: no
The drop-invalid option can be set to no to avoid blocking packets that are
seen invalid by the streaming engine. This can be useful to cover some weird cases
seen in some layer 2 IPS setup.
The bypass option activates 'bypass' for a flow/session when either side
of the session reaches its depth.
Warning
bypass can lead to missing important traffic. Use with care.
Example 11 Normal/IDS mode
Suricata inspects traffic in chunks.
Example 12 Inline/IPS Sliding Window
Suricata inspects traffic in a sliding window manner.
Example 13 Normal/IDS (reasembly on ACK'D data)
Example 14 Inline/IPS (reassembly on UNACK'D data)
The reassembly-engine has to keep data segments in memory in order to be able to reconstruct a stream. To avoid resource starvation a memcap is used to limit the memory used. In IPS mode, an exception policy (memcap-policy) can be set, telling Suricata what to do in case memcap is hit: 'drop-flow', 'drop-packet', 'pass-flow', 'pass-packet', 'bypass', 'reject', or 'ignore'.
Reassembling a stream is an expensive operation. With the option depth you can control how far into a stream reassembly is done. By default this is 1MB. This setting can be overridden per stream by the protocol parsers that do file extraction.
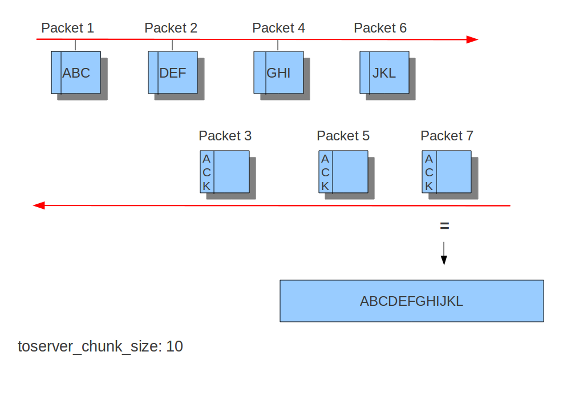
Inspection of reassembled data is done in chunks. The size of these
chunks is set with toserver_chunk_size and toclient_chunk_size.
To avoid making the borders predictable, the sizes van be varied by
adding in a random factor.
reassembly:
  memcap: 256mb             # Memory reserved for stream data reconstruction (in bytes)
  memcap-policy: ignore     # What to do when memcap for reassembly is hit
  depth: 1mb                # The depth of the reassembling.
  toserver_chunk_size: 2560 # inspect raw stream in chunks of at least this size
  toclient_chunk_size: 2560 # inspect raw stream in chunks of at least
  randomize-chunk-size: yes
  #randomize-chunk-range: 10
'Raw' reassembly is done for inspection by simple content, pcre
keywords use and other payload inspection not done on specific protocol
buffers like http_uri. This type of reassembly can be turned off:
reassembly:
  raw: no
Incoming segments are stored in a list in the stream. To avoid constant memory allocations a per-thread pool is used.
reassembly:
  segment-prealloc: 2048    # pre-alloc 2k segments per thread
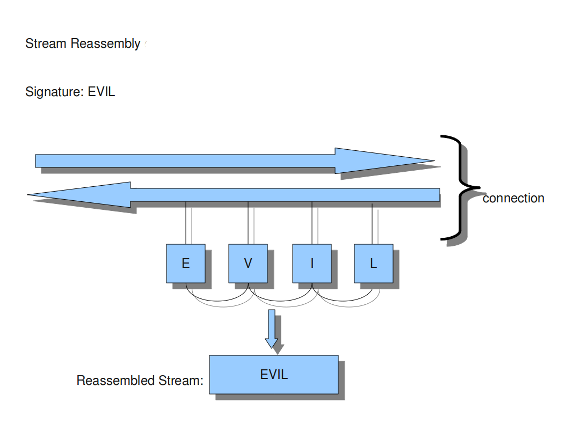
Resending different data on the same sequence number is a way to confuse network inspection.
reassembly:
  check-overlap-different-data: true
Example 15 Stream reassembly
11.1.14. Application Layer Parsers
The app-layer section holds application layer specific configurations.
In IPS mode, a global exception policy accessed via the error-policy
setting can be defined to indicate what the engine should do in case it
encounters an app-layer error. Possible values are "drop-flow", "pass-flow",
"bypass", "drop-packet", "pass-packet", "reject" or "ignore" (which maintains
the default behavior).
Each supported protocol has a dedicated subsection under protocols.
11.1.14.1. Asn1_max_frames (new in 1.0.3 and 1.1)
Asn1 (Abstract Syntax One) is a standard notation to structure and describe data.
Within Asn1_max_frames there are several frames. To protect itself, Suricata will inspect a maximum of 256. You can set this amount differently if wanted.
Application layer protocols such as X.400 electronic mail, X.500 and LDAP directory services, H.323 (VoIP), BACnet and SNMP, use ASN.1 to describe the protocol data units (PDUs) they exchange. It is also extensively used in the Access and Non-Access Strata of UMTS.
Limit for the maximum number of asn1 frames to decode (default 256):
asn1_max_frames: 256
11.1.14.2. FTP
The FTP application layer parser is enabled by default and uses dynamic protocol detection.
By default, FTP control channel commands and responses are limited to 4096
bytes, but this value can be changed. When a command request or response exceeds
the line length limit, the stored data will be truncated, however the parser
will continue to watch for the end of line and acquire the next command.
Commands that are truncated will be noted in the eve log file with the fields
command_truncated or reply_truncated. Please note that this affects the
control messages only, not FTP data (file transfers).
ftp:
  enabled: yes
  #memcap: 64mb

  # Maximum line length for control messages before they will be truncated.
  #max-line-length: 4kb
11.1.14.3. Configure HTTP (libhtp)
The library Libhtp is being used by Suricata to parse HTTP-sessions.
While processing HTTP-traffic, Suricata has to deal with different kind of servers which each process anomalies in HTTP-traffic differently. The most common web-server is Apache. This is an open source web-server program.
Besides Apache, IIS (Internet Information Services/Server) a web-server program of Microsoft is also well-known.
Like with host-os-policy, it is important for Suricata to know which IP-address/network-address is used by which server. In Libhtp this assigning of web-servers to IP-and network addresses is called personality.
Currently Available Personalities:
Minimal
Generic
IDS (default)
IIS_4_0
IIS_5_0
IIS_5_1
IIS_6_0
IIS_7_0
IIS_7_5
Apache
Apache_2_2
You can assign names to each block of settings. Which in this case is -apache and -iis7. Under these names you can set IP-addresses, network-addresses the personality and a set of features.
The version-specific personalities know exactly how web servers behave, and emulate that. The IDS personality would try to implement a best-effort approach that would work reasonably well in the cases where you do not know the specifics.
The default configuration also applies to every IP-address for which no specific setting is available.
HTTP request bodies are often big, so they take a lot of time to process which has a significant impact on the performance. With the option 'request-body-limit' you can set the limit (in bytes) of the client-body that will be inspected. Setting it to 0 will inspect all of the body.
The same goes for HTTP response bodies.
libhtp:

  default-config:
    personality: IDS
    request-body-limit: 3072
    response-body-limit: 3072

  server-config:
     - apache:
         address: [192.168.1.0/24, 127.0.0.0/8, "::1"]
         personality: Apache_2_2
         request-body-limit: 0
         response-body-limit: 0

     - iis7:
         address:
           - 192.168.0.0/24
           - 192.168.10.0/24
         personality: IIS_7_0
         request-body-limit: 4096
         response-body-limit: 8192
Suricata makes available the whole set of libhtp customisations for its users.
You can now use these parameters in the conf to customise suricata's use of libhtp.
# Configures whether backslash characters are treated as path segment
# separators. They are not on Unix systems, but are on Windows systems.
# If this setting is enabled, a path such as "/one\two/three" will be
# converted to "/one/two/three".  Accepted values - yes, no.
#path-convert-backslash-separators: yes

# Configures whether input data will be converted to lowercase.
#path-convert-lowercase: yes

# Configures how the server reacts to encoded NUL bytes.
#path-nul-encoded-terminates: no

# Configures how the server reacts to raw NUL bytes.
#path-nul-raw-terminates: no

# Configures whether consecutive path segment separators will be
# compressed. When enabled, a path such as "/one//two" will be normalized
# to "/one/two". The backslash_separators and decode_separators
# parameters are used before compression takes place. For example, if
# backslash_separators and decode_separators are both enabled, the path
# "/one\\/two\/%5cthree/%2f//four" will be converted to
# "/one/two/three/four".  Accepted values - yes, no.
#path-separators-compress: yes

# Configures whether encoded path segment separators will be decoded.
# Apache does not do this, but IIS does. If enabled, a path such as
# "/one%2ftwo" will be normalized to "/one/two". If the
# backslash_separators option is also enabled, encoded backslash
# characters will be converted too (and subsequently normalized to
# forward slashes).  Accepted values - yes, no.
#path-separators-decode: yes

# Configures whether %u-encoded sequences in path will be decoded. Such
# sequences will be treated as invalid URL encoding if decoding is not
# desireable.  Accepted values - yes, no.
#path-u-encoding-decode: yes

# Configures how server reacts to invalid encoding in path.  Accepted
# values - preserve_percent, remove_percent, decode_invalid, status_400
#path-url-encoding-invalid-handling: preserve_percent

# Controls whether the data should be treated as UTF-8 and converted
# to a single-byte stream using best-fit mapping
#path-utf8-convert-bestfit:yes

# Sets the replacement character that will be used to in the lossy
# best-fit mapping from Unicode characters into single-byte streams.
# The question mark is the default replacement character.
#path-bestfit-replacement-char: ?

# Configures whether plus characters are converted to spaces
# when decoding URL-encoded strings.
#query-plusspace-decode: yes

#   response-body-decompress-layer-limit:
#                           Limit to how many layers of compression will be
#                           decompressed. Defaults to 2.

#   uri-include-all:        Include all parts of the URI. By default the
#                           'scheme', username/password, hostname and port
#                           are excluded.

#   meta-field-limit:       Hard size limit for request and response size
#                           limits.

# inspection limits
    request-body-minimal-inspect-size: 32kb
    request-body-inspect-window: 4kb
    response-body-minimal-inspect-size: 40kb
    response-body-inspect-window: 16kb

# auto will use http-body-inline mode in IPS mode, yes or no set it statically
    http-body-inline: auto

# Decompress SWF files.
# 2 types: 'deflate', 'lzma', 'both' will decompress deflate and lzma
# compress-depth:
# Specifies the maximum amount of data to decompress,
# set 0 for unlimited.
# decompress-depth:
# Specifies the maximum amount of decompressed data to obtain,
# set 0 for unlimited.
    swf-decompression:
      enabled: yes
      type: both
      compress-depth: 0
      decompress-depth: 0

# Take a random value for inspection sizes around the specified value.
# This lower the risk of some evasion technics but could lead
# detection change between runs. It is set to 'yes' by default.
#randomize-inspection-sizes: yes
# If randomize-inspection-sizes is active, the value of various
# inspection size will be choosen in the [1 - range%, 1 + range%]
# range
# Default value of randomize-inspection-range is 10.
#randomize-inspection-range: 10

# Can enable LZMA decompression
#lzma-enabled: false
# Memory limit usage for LZMA decompression dictionary
# Data is decompressed until dictionary reaches this size
#lzma-memlimit: 1 Mb
# Maximum decompressed size with a compression ratio
# above 2048 (only reachable by LZMA)
#compression-bomb-limit: 1 Mb
# Maximum time spent decompressing a single transaction in usec
#decompression-time-limit: 100000
Other parameters are customizable from Suricata.
#   double-decode-path:     Double decode path section of the URI
#   double-decode-query:    Double decode query section of the URI
11.1.14.3.1. decompression-time-limit
decompression-time-limit was implemented to avoid DOS by resource exhaustion
on inputs such as decompression bombs (found by fuzzing).
The lower the limit, the better the protection against DOS is, but this
may also lead to false positives.
In case the time limit is reached,
the app-layer event http.compression_bomb is set
(this event can also set from other conditions).
This can happen on slow configurations (hardware, ASAN, etc...)
11.1.14.4. Configure HTTP2
HTTP keywords can be enabled to match on HTTP1 traffic.
To do so, you should set app-layer.protocols.http2.http1-rules.
In this case, you cannot have HTTP1-only rules.
11.1.14.5. Configure SMB
The SMB parser will parse version 1, 2 and 3 of the SMB protocol over TCP.
To enable the parser add the following to the app-layer section of the YAML.
smb:
  enabled: yes
  detection-ports:
    dp: 139, 445
The parser uses pattern based protocol detection and will fallback to probing parsers
if the pattern based detection fails. As usual, the pattern based detection is port
independent. The probing parsers will only run on the detection-ports.
SMB is commonly used to transfer the DCERPC protocol. This traffic is also handled by this parser.
11.1.14.5.1. Resource limits
Several options are available for limiting record sizes and data chunk tracking.
smb:
  enabled: yes
  max-read-size: 8mb
  max-write-size: 1mb

  max-read-queue-size: 16mb
  max-read-queue-cnt: 16

  max-write-queue-size: 16mb
  max-write-queue-cnt: 16
The max-read-size option can be set to control the max size of accepted READ records. Events will be raised if a READ request asks for too much data and/or if READ responses are too big. A value of 0 disables the checks.
The max-write-size option can be set to control the max size of accepted WRITE request records. Events will be raised if a WRITE request sends too much data. A value of 0 disables the checks.
Additionally if the max-read-size or max-write-size values in the "negotiate protocol response" exceeds this limit an event will also be raised.
For file tracking, extraction and file data inspection the parser queues up out of order data chunks for both READs and WRITEs. To avoid using too much memory the parser allows for limiting both the size in bytes and the number of queued chunks.
smb:
  enabled: yes

  max-read-queue-size: 16mb
  max-read-queue-cnt: 16

  max-write-queue-size: 16mb
  max-write-queue-cnt: 16
max-read-queue-size controls how many bytes can be used per SMB flow for out of order READs. max-read-queue-cnt controls how many READ chunks can be queued per SMB flow. Processing of these chunks will be blocked when any of the limits are exceeded, and an event will be raised.
max-write-queue-size and max-write-queue-cnt are as the READ variants, but then for WRITEs.
11.1.14.6. SSL/TLS
SSL/TLS parsers track encrypted SSLv2, SSLv3, TLSv1, TLSv1.1 and TLSv1.2 sessions.
Protocol detection is done using patterns and a probing parser running on only TCP/443 by default. The pattern based protocol detection is port independent.
tls:
  enabled: yes
  detection-ports:
    dp: 443

  # What to do when the encrypted communications start:
  # - default: keep tracking TLS session, check for protocol anomalies,
  #            inspect tls_* keywords. Disables inspection of unmodified
  #            'content' signatures.
  # - bypass:  stop processing this flow as much as possible. No further
  #            TLS parsing and inspection. Offload flow bypass to kernel
  #            or hardware if possible.
  # - full:    keep tracking and inspection as normal. Unmodified content
  #            keyword signatures are inspected as well.
  #
  # For best performance, select 'bypass'.
  #
  #encryption-handling: default
11.1.14.6.1. Encrypted traffic
There is no decryption of encrypted traffic, so once the handshake is complete
continued tracking of the session is of limited use. The encryption-handling
option controls the behavior after the handshake.
If encryption-handling is set to default (or if the option is not set),
Suricata will continue to track the SSL/TLS session. Inspection will be limited,
as raw content inspection will still be disabled. There is no point in doing
pattern matching on traffic known to be encrypted. Inspection for (encrypted)
Heartbleed and other protocol anomalies still happens.
When encryption-handling is set to bypass, all processing of this session is
stopped. No further parsing and inspection happens. If stream.bypass is enabled
this will lead to the flow being bypassed, either inside Suricata or by the
capture method if it supports it and is configured for it.
Finally, if encryption-handling is set to full, Suricata will process the
flow as normal, without inspection limitations or bypass.
The option has replaced the no-reassemble option. If no-reassemble is
present, and encryption-handling is not, false is interpreted as
encryption-handling: default and true is interpreted as
encryption-handling: bypass.
11.1.14.7. Modbus
According to MODBUS Messaging on TCP/IP Implementation Guide V1.0b, it is recommended to keep the TCP connection opened with a remote device and not to open and close it for each MODBUS/TCP transaction. In that case, it is important to set the stream-depth of the modbus as unlimited.
modbus:
  # Stream reassembly size for modbus, default is 0
  stream-depth: 0
11.1.14.8. MQTT
The maximum size of a MQTT message is 256MB, potentially containing a lot of payload data (such as properties, topics, or published payloads) that would end up parsed and logged. To acknowledge the fact that most MQTT messages, however, will be quite small and to reduce the potential for denial of service issues, it is possible to limit the maximum length of a message that Suricata should parse. Any message larger than the limit will just be logged with reduced metadata, and rules will only be evaluated against a subset of fields. The default is 1 MB.
mqtt:
  max-msg-length: 1mb
11.1.14.9. SMTP
SMTP parsers can extract files from attachments.
It is also possible to extract raw conversations as files with the
key raw-extraction. Note that in this case the whole conversation
will be stored as a file, including SMTP headers and body content. The filename
will be set to "rawmsg". Usual file-related signatures will match on the raw
content of the email.
This configuration parameter has a false default value. It is
incompatible with decode-mime. If both are enabled,
raw-extraction will be automatically disabled.
smtp:
  # extract messages in raw format from SMTP
  raw-extraction: true
11.1.15. Engine Logging
The engine logging system logs information about the application such as errors and other diagnostic information during startup, runtime and shutdown of the Suricata engine. This does not include Suricata generated alerts and events.
The engine logging system has the following log levels:
error
warning
notice
info
perf
config
debug
Note that debug level logging will only be emitted if Suricata was
compiled with the --enable-debug configure option.
The first option within the logging configuration is the default-log-level. This option determines the severity/importance level of information that will be displayed. Messages of lower levels than the one set here, will not be shown. The default setting is Info. This means that error, warning and info will be shown and the other levels won't be.
11.1.15.1. Default Configuration Example
# Logging configuration.  This is not about logging IDS alerts/events, but
# output about what Suricata is doing, like startup messages, errors, etc.
logging:
  # The default log level, can be overridden in an output section.
  # Note that debug level logging will only be emitted if Suricata was
  # compiled with the --enable-debug configure option.
  #
  # This value is overridden by the SC_LOG_LEVEL env var.
  default-log-level: notice

  # The default output format.  Optional parameter, should default to
  # something reasonable if not provided.  Can be overridden in an
  # output section.  You can leave this out to get the default.
  #
  # This value is overridden by the SC_LOG_FORMAT env var.
  #default-log-format: "[%i] %t - (%f:%l) <%d> (%n) -- "

  # A regex to filter output.  Can be overridden in an output section.
  # Defaults to empty (no filter).
  #
  # This value is overridden by the SC_LOG_OP_FILTER env var.
  default-output-filter:

  # Define your logging outputs.  If none are defined, or they are all
  # disabled you will get the default - console output.
  outputs:
  - console:
      enabled: yes
      # type: json
  - file:
      enabled: yes
      level: info
      filename: suricata.log
      # type: json
  - syslog:
      enabled: no
      facility: local5
      format: "[%i] <%d> -- "
      # type: json
11.1.15.2. Default Log Level
Example:
logging:
  default-log-level: info
This option sets the default log level. The default log level is notice. This value will be used in the individual logging configuration (console, file, syslog) if not otherwise set.
Note
The -v command line option can be used to quickly
increase the log level at runtime. See the -v command
line option.
The default-log-level set in the configuration value can be
overriden by the SC_LOG_LEVEL environment variable.
11.1.15.3. Default Log Format
A logging line exists of two parts. First it displays meta information (thread id, date etc.), and finally the actual log message. Example:
[27708] 15/10/2010 -- 11:40:07 - (suricata.c:425) <Info> (main) – This is Suricata version 1.0.2
(Here the part until the – is the meta info, "This is Suricata 1.0.2" is the actual message.)
It is possible to determine which information will be displayed in this line and (the manner how it will be displayed) in which format it will be displayed. This option is the so called format string:
default-log-format: "[%i] %t - (%f:%l) <%d> (%n) -- "
The % followed by a character, has a special meaning. There are eight specified signs:
t:      Time, timestamp, time and date
                      example: 15/10/2010 - -11:40:07
p:      Process ID. Suricata's whole processing consists of multiple threads.
i:      Thread ID. ID of individual threads.
m:      Thread module name. (Outputs, Detect etc.)
d:      Log-level of specific log-event. (Error, info, debug etc.)
f:      Filename. Name of C-file (source code) where log-event is generated.
l:      Line-number within the filename, where the log-event is generated in the source-code.
n:      Function-name in the C-code (source code).
The last three, f, l and n are mainly convenient for developers.
The log-format can be overridden in the command line by the environment variable: SC_LOG_FORMAT
11.1.15.4. Output Filter
Within logging you can set an output-filter. With this output-filter you can set which part of the event-logs should be displayed. You can supply a regular expression (Regex). A line will be shown if the regex matches.
default-output-filter: #In this option the regular expression can be entered.
This value is overridden by the environment var: SC_LOG_OP_FILTER
11.1.15.5. Logging Outputs
There are different ways of displaying output. The output can appear directly on your screen, it can be placed in a file or via syslog. The last mentioned is an advanced tool for log-management. The tool can be used to direct log-output to different locations (files, other computers etc.)
outputs:
  - console:                                    #Output on your screen.
      enabled: yes                              #This option is enabled.
      #level: notice                            #Use a different level than the default.
  - file:                                       #Output stored in a file.
      enabled: no                               #This option is not enabled.
      filename: /var/log/suricata.log           #Filename and location on disc.
      level: info                               #Use a different level than the default.
  - syslog:                                     #This is a program to direct log-output to several directions.
      enabled: no                               #The use of this program is not enabled.
      facility: local5                          #In this option you can set a syslog facility.
      format: "[%i] <%d> -- "                   #The option to set your own format.
      #level: notice                            #Use a different level than the default.
11.1.16. Packet Acquisition
11.1.16.1. Pf-ring
The Pf_ring is a library that aims to improve packet capture performance over libcap. It performs packet acquisition. There are three options within Pf_ring: interface, cluster-id and cluster-type.
pfring:
  interface: eth0    # In this option you can set the network-interface
                     # on which you want the packets of the network to be read.
Pf_ring will load balance packets based on flow. All packet acquisition threads that will participate in the load balancing need to have the same cluster-id. It is important to make sure this ID is unique for this cluster of threads, so that no other engine / program is making use of clusters with the same id.
cluster-id: 99
Pf_ring can load balance traffic using pf_ring-clusters. All traffic for pf_ring can be load balanced according to the configured cluster type value; in a round robin manner or a per flow manner that are part of the same cluster. All traffic for pf_ring will be load balanced across acquisition threads of the same cluster id.
The "inner" flow means that the traffic will be load balanced based on address tuple after the outer vlan has been removed.
Cluster Type |
Value |
|---|---|
cluster_flow |
src ip, src_port, dst ip, dst port, proto, vlan |
cluster_inner_flow |
src ip, src port, dst ip, dst port, proto, vlan |
cluster_inner_flow_2_tuple |
src ip, dst ip |
cluster_inner_flow_4_tuple |
src ip, src port, dst ip, dst port |
cluster_inner_flow_5_tuple |
src ip, src port, dst ip, dst port, proto |
cluster_round_robin |
not recommended |
The cluster_round_robin manner is a way of distributing packets one at a time to each thread (like distributing playing cards to fellow players). The cluster_flow manner is a way of distributing all packets of the same flow to the same thread. The flows itself will be distributed to the threads in a round-robin manner.
If your deployment has VLANs, the cluster types with "inner" will use the innermost address tuple for distribution.
The default cluster type is cluster_flow; the cluster_round_robin is not recommended with Suricata.
cluster-type: cluster_inner_flow_5_tuple
11.1.16.2. NFQ
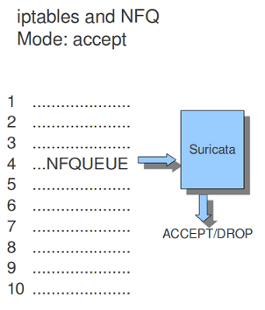
Using NFQUEUE in iptables rules, will send packets to Suricata. If the mode is set to 'accept', the packet that has been send to Suricata by a rule using NFQ, will by default not be inspected by the rest of the iptables rules after being processed by Suricata. There are a few more options to NFQ to change this if desired.
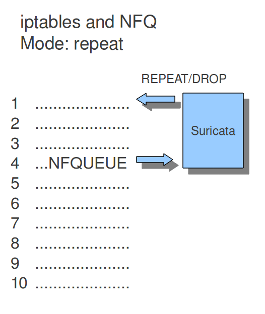
If the mode is set to 'repeat', the packets will be marked by Suricata and be re-injected at the first rule of iptables. To mitigate the packet from being going round in circles, the rule using NFQ will be skipped because of the mark.
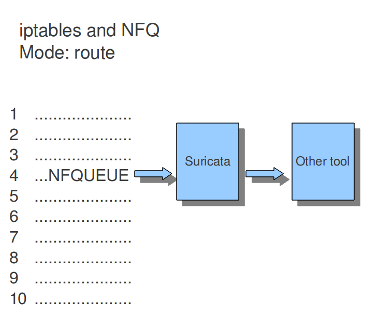
If the mode is set to 'route', you can make sure the packet will be send to another tool after being processed by Suricata. It is possible to assign this tool at the mandatory option 'route_queue'. Every engine/tool is linked to a queue-number. This number you can add to the NFQ rule and to the route_queue option.
Add the numbers of the options repeat_mark and route_queue to the NFQ-rule:
iptables -I FORWARD -m mark ! --mark $MARK/$MASK -j NFQUEUE
nfq:
   mode: accept                 #By default the packet will be accepted or dropped by Suricata
   repeat_mark: 1               #If the mode is set to 'repeat', the packets will be marked after being
                                #processed by Suricata.
   repeat_mask: 1
   route_queue: 2               #Here you can assign the queue-number of the tool that Suricata has to
                                #send the packets to after processing them.
Example 1 NFQ1
mode: accept
Example 2 NFQ
mode: repeat
Example 3 NFQ
mode: route
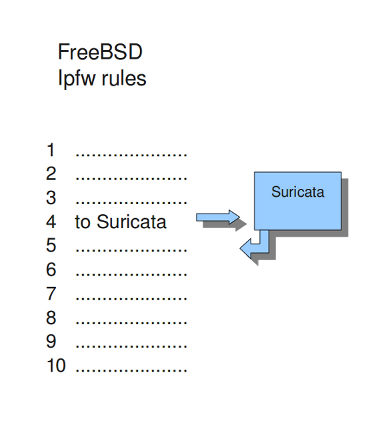
11.1.16.3. Ipfw
Suricata does not only support Linux, it supports the FreeBSD operating system (this is an open source Unix operating system) and Mac OS X as well. The in-line mode on FreeBSD uses ipfw (IP-firewall).
Certain rules in ipfw send network-traffic to Suricata. Rules have numbers. In this option you can set the rule to which the network-traffic will be placed back. Make sure this rule comes after the one that sends the traffic to Suricata, otherwise it will go around in circles.
The following tells the engine to re-inject packets back into the ipfw firewall at rule number 5500:
ipfw:
  ipfw-reinjection-rule-number: 5500
Example 16 Ipfw-reinjection.
11.1.17. Rules
11.1.17.1. Rule-files
For different categories of risk there are different rule-files available containing one or more rules. There is a possibility to instruct Suricata where to find these rules and which rules you want to be load for use. You can set the directory where the files can be found.
default-rule-path: /etc/suricata/rules/
rule-files:
  - backdoor.rules
  - bad-traffic.rules
  - chat.rules
  - ddos.rules
  - ....
The above mentioned is an example of rule-files of which can be chosen from. There are much more rule-files available.
If wanted, you can set a full path for a specific rule or rule-file. In that case, the above directory (/etc/suricata/rules/) will be ignored for that specific file. This is convenient in case you write your own rules and want to store them separate from other rules like that of VRT, ET or ET pro.
If you set a file-name that appears to be not existing, Suricata will ignore that entry and display a error-message during the engine startup. It will continue with the startup as usual.
11.1.17.2. Threshold-file
Within this option, you can state the directory in which the threshold-file will be stored. The default directory is: /etc/suricata/threshold.config
11.1.17.3. Classifications
The Classification-file is a file which makes the purpose of rules clear.
Some rules are just for providing information. Some of them are to warn you for serious risks like when you are being hacked etc.
In this classification-file, there is a part submitted to the rule to make it possible for the system-administrator to distinguish events.
A rule in this file exists of three parts: the short name, a description and the priority of the rule (in which 1 has the highest priority and 4 the lowest).
You can notice these descriptions returning in the rule and events / alerts.
Example:

configuration classification: misc-activity,Misc activity,3

Rule:

alert tcp $HOME_NET 21 -> $EXTERNAL_NET any (msg:"ET POLICY FTP Login Successful (non-anonymous)";
flow:from_server,established;flowbits:isset,ET.ftp.user.login; flowbits:isnotset,ftp.user.logged_in;
flowbits:set,ftp.user.logged_in; content:"230 ";pcre:!"/^230(\s+USER)?\s+(anonymous|ftp)/smi";
classtype:misc-activity; reference:urldoc.emergingthreats.net/2003410,;
reference:url,www.emergingthreats.net/cgi-bin/cvsweb.cgi/sigs/POLICY/POLICY_FTP_Login; sid:2003410; rev:7;)

Event/Alert:

10/26/10-10:13:42.904785  [**] [1:2003410:7] ET POLICY FTP Login Successful (non-anonymous) [**]
 [Classification: Misc activity[Priority: 3] {TCP} 192.168.0.109:21 -> x.x.x.x:34117
You can set the direction of the classification configuration.
classification-file: /etc/suricata/classification.config
11.1.17.4. Rule-vars
There are variables which can be used in rules.
Within rules, there is a possibility to set for which IP-address the rule should be checked and for which IP-address it should not.
This way, only relevant rules will be used. To prevent you from having to set this rule by rule, there is an option in which you can set the relevant IP-address for several rules. This option contains the address group vars that will be passed in a rule. So, after HOME_NET you can enter your home IP-address.
vars:
  address-groups:
    HOME_NET: "[192.168.0.0/16,10.0.0.0/8,172.16.0.0/12]"        #By using [], it is possible to set
                                                                 #complicated variables.
    EXTERNAL_NET: any
    HTTP_SERVERS: "$HOME_NET"                                    #The $-sign tells that what follows is
                                                                 #a variable.
    SMTP_SERVERS: "$HOME_NET"
    SQL_SERVERS: "$HOME_NET"
    DNS_SERVERS: "$HOME_NET"
    TELNET_SERVERS: "$HOME_NET"
    AIM_SERVERS: any
It is a convention to use upper-case characters.
There are two kinds of variables: Address groups and Port-groups. They both have the same function: change the rule so it will be relevant to your needs.
In a rule there is a part assigned to the address and one to the port. Both have their variable.
All options have to be set. If it is not necessary to set a specific address, you should enter 'any'.
port-groups:
  HTTP_PORTS: "80"
  SHELLCODE_PORTS: "!80"
  ORACLE_PORTS: 1521
  SSH_PORTS: 22
11.1.17.5. Host-os-policy
Operating systems differ in the way they process fragmented packets and streams. Suricata performs differently with anomalies for different operating systems. It is important to set of which operating system your IP-address makes use of, so Suricata knows how to process fragmented packets and streams. For example in stream-reassembly there can be packets with overlapping payloads.
Example 17 Overlapping payloads
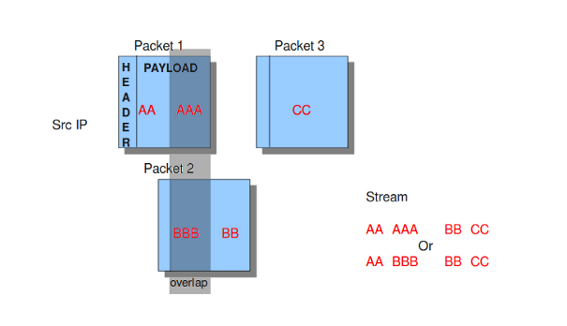
In the configuration-file, the operating-systems are listed. You can add your IP-address behind the name of the operating system you make use of.
host-os-policy:
  windows: [0.0.0.0/0]
  bsd: []
  bsd_right: []
  old_linux: []
  linux: [10.0.0.0/8, 192.168.1.100, "8762:2352:6241:7245:E000:0000:0000:0000"]
  old_solaris: []
  solaris: ["::1"]
  hpux10: []
  hpux11: []
  irix: []
  macos: []
  vista: []
  windows2k3: []
11.1.18. Engine analysis and profiling
Suricata offers several ways of analyzing performance of rules and the engine itself.
11.1.18.1. Engine-analysis
The option engine-analysis provides information for signature writers about how Suricata organizes signatures internally.
Like mentioned before, signatures have zero or more patterns on which they can match. Only one of these patterns will be used by the multi pattern matcher (MPM). Suricata determines which patterns will be used unless the fast-pattern rule option is used.
The option engine-analysis creates a new log file in the default log dir. In this file all information about signatures and patterns can be found so signature writers are able to see which pattern is used and change it if desired.
To create this log file, you have to run Suricata with ./src/suricata -c suricata.yaml --engine-analysis.
engine-analysis:
   rules-fast-pattern: yes
Example:
[10703] 26/11/2010 -- 11:41:15 - (detect.c:560) <Info> (SigLoadSignatures)
-- Engine-Analysis for fast_pattern printed to file - /var/log/suricata/rules_fast_pattern.txt

== Sid: 1292 ==
Fast pattern matcher: content
Fast pattern set: no
Fast pattern only set: no
Fast pattern chop set: no
Content negated: no
Original content: Volume Serial Number
Final content: Volume Serial Number

---

alert tcp any any -> any any (content:"abc"; content:"defghi"; sid:1;)

== Sid: 1 ==
Fast pattern matcher: content
Fast pattern set: no
Fast pattern only set: no
Fast pattern chop set: no
Content negated: no
Original content: defghi
Final content: defghi

---

alert tcp any any -> any any (content:"abc"; fast_pattern:only; content:"defghi"; sid:1;)

== Sid: 1 ==
Fast pattern matcher: content
Fast pattern set: yes
Fast pattern only set: yes
Fast pattern chop set: no
Content negated: no
Original content: abc
Final content: abc

---

alert tcp any any -> any any (content:"abc"; fast_pattern; content:"defghi"; sid:1;)

== Sid: 1 ==
Fast pattern matcher: content
Fast pattern set: yes
Fast pattern only set: no
Fast pattern chop set: no
Content negated: no
Original content: abc
Final content: abc

---

alert tcp any any -> any any (content:"abc"; fast_pattern:1,2; content:"defghi"; sid:1;)

== Sid: 1 ==
Fast pattern matcher: content
Fast pattern set: yes
Fast pattern only set: no
Fast pattern chop set: yes
Fast pattern offset, length: 1, 2
Content negated: no
Original content: abc
Final content: bc
11.1.18.2. Rule and Packet Profiling settings
Rule profiling is a part of Suricata to determine how expensive rules are. Some rules are very expensive while inspecting traffic. Rule profiling is convenient for people trying to track performance problems and resolving them. Also for people writing signatures.
Compiling Suricata with rule-profiling will have an impact on performance, even if the option is disabled in the configuration file.
To observe the rule-performance, there are several options.
profiling:
  rules:
    enabled: yes
This engine is not used by default. It can only be used if Suricata is compiled with:
-- enable-profiling
At the end of each session, Suricata will display the profiling statistics. The list will be displayed sorted.
This order can be changed as pleased. The choice is between ticks, avgticks, checks, maxticks and matches. The setting of your choice will be displayed from high to low.
The amount of time it takes to check the signatures, will be administrated by Suricata. This will be counted in ticks. One tick is one CPU computation. 3 GHz will be 3 billion ticks.
Beside the amount of checks, ticks and matches it will also display the average and the maximum of a rule per session at the end of the line.
The option Limit determines the amount of signatures of which the statistics will be shown, based on the sorting.
sort: avgticks
limit: 100
Example of how the rule statistics can look like;
Rule            Ticks            %     Checks         Matches           Max Tick         Avg
Ticks

7560            107766621       0.02    138             37              105155334       780917.54
11963           1605394413      0.29    2623             1              144418923       612045.14
7040            1431034011      0.26    2500             0              106018209       572413.60
5726            1437574662      0.26    2623             1              115632900       548065.06
7037            1355312799      0.24    2562             0              116048286       529005.78
11964           1276449255      0.23    2623             1              96412347        486637.15
7042            1272562974      0.23    2623             1              96405993        485155.54
5719            1233969192      0.22    2562             0              106439661       481642.93
5720            1204053246      0.21    2562             0              125155431       469966.14
11.1.18.3. Packet Profiling
packets:

  # Profiling can be disabled here, but it will still have a
  # performance impact if compiled in.


  enabled: yes                                  #this option is enabled by default
  filename: packet_stats.log                    #name of the file in which packet profiling information will be
                                                #stored.
  append: yes                                   #If set to yes, new packet profiling information will be added to the
                                                #information that was saved last in the file.

  # per packet csv output
  csv:

    # Output can be disabled here, but it will still have a
    # performance impact if compiled in.

    enabled: no                                #the sending of packet output to a csv-file is by default disabled.
    filename: packet_stats.csv                 #name of the file in which csv packet profiling information will be
                                               #stored
Packet profiling is enabled by default in suricata.yaml but it will only do its job if you compiled Suricata with --enable profiling.
The filename in which packet profiling information will be stored, is packet-stats.log. Information in this file can be added to the last information that was saved there, or if the append option is set to no, the existing file will be overwritten.
Per packet, you can send the output to a csv-file. This file contains one line for each packet with all profiling information of that packet. This option can be used only if Suricata is build with --enable-profiling and if the packet profiling option is enabled in yaml.
It is best to use runmode 'single' if you would like to profile the speed of the code. When using a single thread, there is no situation in which two threads have to wait for each other. When using two threads, the time threads might have to wait for each other will be taken in account when/during profiling packets. For more information see Packet Profiling.
11.1.19. Decoder
11.1.19.1. Teredo
The Teredo decoder can be disabled. It is enabled by default.
decoder:
  # Teredo decoder is known to not be completely accurate
  # it will sometimes detect non-teredo as teredo.
  teredo:
    enabled: true
    # ports to look for Teredo. Max 4 ports. If no ports are given, or
    # the value is set to 'any', Teredo detection runs on _all_ UDP packets.
    ports: $TEREDO_PORTS # syntax: '[3544, 1234]'
Using this default configuration, Teredo detection will run on UDP port 3544. If the ports parameter is missing, or set to any, all ports will be inspected for possible presence of Teredo.
11.1.20. Advanced Options
11.1.20.1. stacktrace
Display diagnostic stacktraces when a signal unexpectedly terminates Suricata, e.g., such as
SIGSEGV or SIGABRT. Requires the libunwind library to be available. The default value is
to display the diagnostic message if a signal unexpectedly terminates Suricata -- e.g.,
SIGABRT or SIGSEGV occurs while Suricata is running.
logging:
    # Requires libunwind to be available when Suricata is configured and built.
    # If a signal unexpectedly terminates Suricata, displays a brief diagnostic
    # message with the offending stacktrace if enabled.
    #stacktrace-on-signal: on
11.1.20.2. luajit
11.1.20.2.1. states
Luajit has a strange memory requirement, it's 'states' need to be in the first 2G of the process' memory. For this reason when luajit is used the states are allocated at the process startup. This option controls how many states are preallocated.
If the pool is depleted a warning is generated. Suricata will still try to continue, but may fail if other parts of the engine take too much memory. If the pool was depleted a hint will be printed at the engines exit.
States are allocated as follows: for each detect script a state is used per detect thread. For each output script, a single state is used. Keep in mind that a rule reload temporary doubles the states requirement.
11.1.21. Configuration hardening
11.1.21.1. Lua
Suricata 6.0.13 disables Lua rules by default. Lua rules can be
enabled in the security.lua section of the configuration file:
security:
  lua:
    # Allow Lua rules. Disabled by default.
    #allow-rules: false